


The Janus Factor: What Next in 2025?
Happy New Year, welcome to 2025 and all hail Jânus!

Happy New Year, welcome to 2025 and all hail Jânus! :) The calendar month of January originates from ancient Roman culture, named after Jânus, a dual-faced god that could see both the future and past. Indeed, over the ages this archetypal symbology has influenced our collective psychology and even financial market analysis.

One such manifestation is a seasonality pattern termed, “the January Barometer” (JB), which infers stock market performance in the coming year. Put simply: “as the year starts, is how the year will [likely] go”. The JB was popularised in the Stock Trader’s Almanac in 1973 by seasonality expert Yale Hirsh and recently studied in a paper. In behavioural terms, the JB measures investor sentiment at the turn of the year, which is often a pivotal time. However, it can also serve as linear trend extrapolation, while experience teaches us that the trend is your friend – except at the end where it bends!

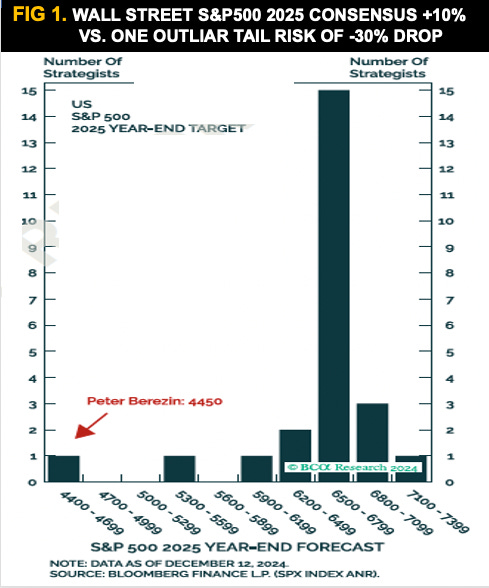
Indeed, the ancient Roman god of Jânus had the qualities of a good investor, with a supernatural advantage to judge the right balance and context of historical precedent, when considering future performance. All too often mortal investors develop hindsight bias after strong trends, hypnotised by a rearview mirror of their past returns, and fail to identify and adapt to a potentially changing market landscape at key inflection points. This new year is likely a case in point, after a two-year stock market bull rally, amplified by record investor exuberance. Meanwhile, the Wall Street consensus prediction is for S&P500 to rise another 10% or so in 2025 vs one outlier tail risk of -30% drop (Figure 1).
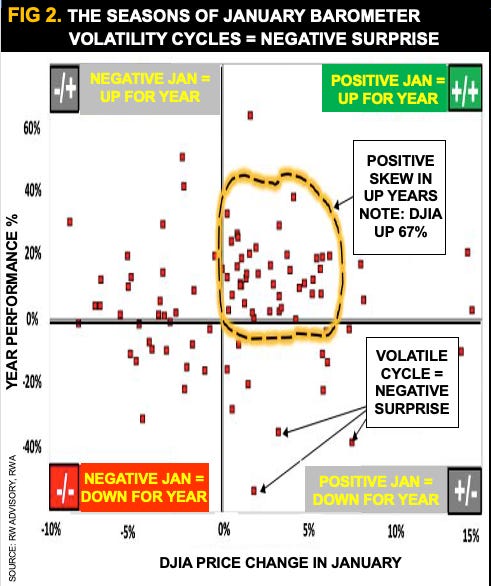
Looking back at the JB pattern, there are four different seasons (Figure 2), including examples of trend extrapolation (+/+ & -/- quadrant) and mean-reversion (+/- & -/+ quadrant).
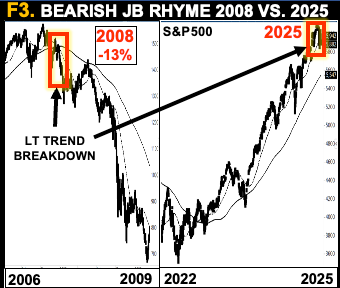
A Thematic variation is the 2008 GFC, which featured one of the worst January performances (-13%), echoed during 2022 and potentially now (Figure 3). Mr. Hirsh later developed the “January Indicator Trifecta” (JIT) - including the Santa Claus Rally (SCR), which typically extends gains during late December into early New Year, as a composite prelude to future market performance.
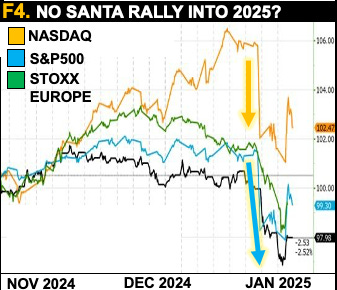
If the January Trifecta is hit and all three are positive, then S&P500 is up 90.6% of the time, with an average gain of 17.7%. A contrarian setup, according to his work is “if Santa Claus should fail to call, bears may come to Broad and Wall” – signifying the value (Russell 2000) and blue chip (DJI) stocks. This poetic omen seems to be playing out with a weak new-year start (Figure 4), that continues to exhibit trend reversal characteristics.
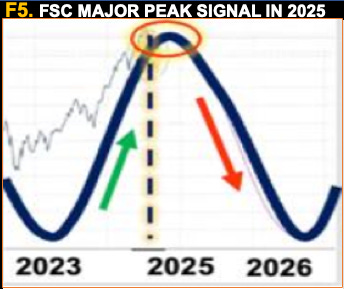
Recall the triple whammy thesis of momentum exhaustion, rotation fragility and bearish timing confluence. The latter is bear case is featured in prior RWA reports and media interviews. Our strategy playbook continues to favour a tactical “buy the rumour, fade the fact” into the coming US inauguration of 20th January, an unwinding of pressured overbought momentum and a first 100-day policy stress-test. This aligns with heightened risk of a major peak into H1 2025, based on analysis from the Foundation for the Study of Cycles (FSC)- Figure 5.
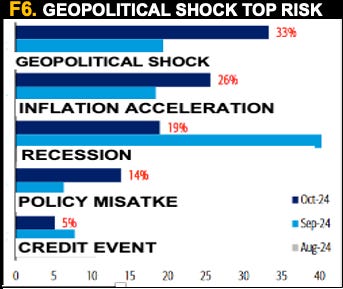
Join the FSC Market Forecast 2025 free online event this month between 14-16th Jan, at 4pm EST, for in-depth analysis from industry peers and myself. Stay alert until then, as geopolitical shock remains a top-of-mind tail-risk (Figure 6) and take heed of the Janus factor’s adaptive strategy.
Welcome feedback, likes and re-shares. Also remember to check our RWA premium services, for enhanced alpha performance, unique insights & proprietary market timing signals. Select link for more details: https://ronwilliam.substack.com/about