Only when the tide goes out
RW Advisory’s warning proved timely for the “growing probability of a dramatic ‘flash crash risk into Q3, [from early August onwards],” as flagged in client reports and media interviews such as Real Vision themed “Rally on Thin Ice”.” What next? Recall one of Warren Buffett’s most famous insights, post-crash, which forewarns of the resurfacing tide and folly of submerged risks. The quote’s full wisdom is that “only when the tide goes out do you learn who has been swimming naked” – which reveals a perfect storm of event triggers, present and likely future.
Most formidable, is the recent sharp appreciation of JPY coinciding with a spike in cross-asset volatility, thereby heightening focus on the “JPY carry trade”. Many are debating the scale and impact of a broader unwind, with some using Japan’s foreign portfolio investments to estimate as much as $4 trillion. Meanwhile, the more polarising question is on the impact, post-shock and remaining. JP Morgan cites only half and Goldman Sachs is on the extreme side of 90%, based on futures positioning, with net shorts falling to just $1bn from a peak of near $15bn in just a few weeks.
However, there are three key considerations to note. 1) Data limitation. 2) Market fluctuations. 3) Asymmetric reflexivity.Firstly, the data is limited to the futures market and excludes “stickier” parts of the investor space. Secondly, it assumes market valuations remain stable, but according to my analysis JPY is still extremely undervalued, with USDJPY’s corrective breakdown targeting 140, with risk into 134 (Figure 1). Additionally, JPY net shorts hit its 2007 record peak and will likely mean-revert to a new long regime (Figure 2), as part of a bigger JPY cycle wave (Figure 3)
JPY deleveraging is further accentuated by relative USD vulnerability risk. This is based several key factors, including relative G10FX performance measured in a positioning and valuation model (Figure 4a). Additional concerns are also found in DXY’s technical regime, after its latest breakdown reactivates the major top reversal pattern (Figure 4b). This is further supported by the Foundation for the study of cycles (FSC) timing model (Figure 4c)
It compounds, as part the market’s asymmetric reflexivity, whereby investors’ biased beliefs and intensified risk aversion drag on performance. In some extreme cases, investors will literally sell first and think later! In fact, this is the very nature of a bull-trap squeeze remains in play on S&P500, leading to additional forced selling under 5200 (Figure 5). This is a variation of the corrective pattern last seen during the 2007 peak, with ultimately led to the global financial crisis of 2008.
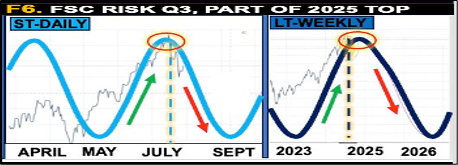
Furthermore, a bearish timing confluence weighs and was featured in a recent CNBC interview. It includes near-term pressure from mid-Aug onwards, amidst imminent geopolitical risk (Iran-Israel), Q3 weak seasonality, notably Sept-Oct, counting down to US election uncertainty. The FSC model signals ST risk, as part of a LT strategic top into 2025 (Figure 6
A top macro event risk during this time window, is for the potential for a Fed policy checkmate scenario, in-line with a precarious historical rhyme (Figure 7). With real rates now at 2%+ for a while, it’s important to review past episodes to be aware of what happens to the tide when the Fed forces such a tight policy for too long!


