How High is the High?
When you have climbed up a mountain as far as it is possible to go, then predicting your next direction is easy.

When you have climbed up a mountain as far as it is possible to go, then predicting your next direction is easy. There is only one way to go, and it is downwards. Staying on some wonderful high plateau and walking like a fairy with the Gods is not going to happen. Of course, on a real mountain it is misty, stormy and it may not be possible to tell how near the actual summit is. Even in the mist you should get an idea that it is close at hand.
Roadmap signature model
My career debut in the City of London was in 1966, joining the large stockbroker of Phillips & Drew, with a background in mechanical engineering. I had come from Joseph Lucas Industries. Price data analysis was based on the same approach used with engineering data, such as regression analysis. This was considered a breakthrough at the time and developed into the original, now expanded “Roadmap Signature model” (Figure 1). Most investors used a ruler, connecting the highs or lows, resulting with a trend-line on the threshold of breaking.
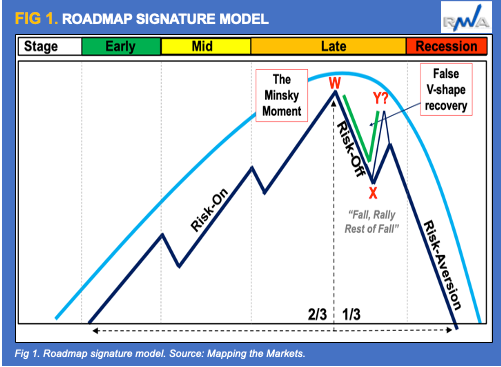
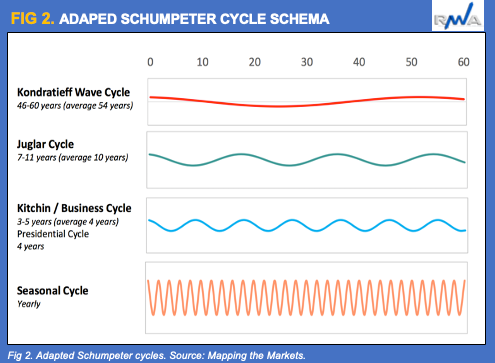
My system didn’t measure the giants or the dwarfs of the population, but the average mean. It resulted with two parallel lines. These were 1-2 standard deviations, with a 95% probability. It helped signal a trend change. It also became quick to notice that when the trend changed, there were certain regular patterns. In fact cycles were occurring. With my degree in economics, I remembered the cycles taught by Joseph Schumpeter (Figure 2). These proved a good explanation for some of what was going on.
Mapping the Markets
We need to break here and explain that if a share price goes up top to hit a high, and then falls back to make a low. This process can go on a long time and is repetitive, but it is not a cycle. There is no sinewave involved. The swings can be random. However, the cycles I was measuring were fundamental and cyclical (Figure 3). They could be projected into the future with a degree of probability of getting the correct answer.
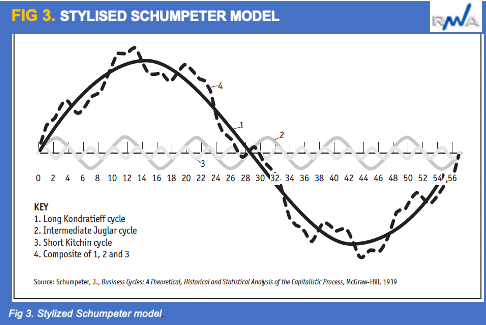
For many years, the main cycles used were from Schumpeter, all supported by good economic data, and there was also a seasonal deviation in any year. I was able to draw out roadmap predictions of how markets could progress based on these cycles, driven also by a special shape that buyers and sellers would produce by interacting with each other.
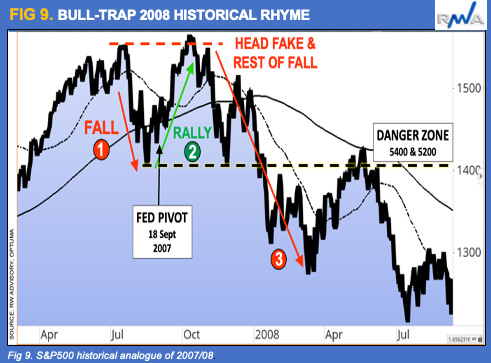
This shape would typically make a bull-trend a five-legged animal, and a bear phase a three-legged affair of a “fall, followed by a rally, then the rest of the fall”. For years I published these on almost all major stock markets. The bottom-line is that although some moves can be random, in all real markets, trends appear more frequently and persist for longer than the laws of chance allow. Several key insights are published in books themed “Mapping the Markets” & “Future Storm” (Figure 4).
Ranking model, fear resurgence: A tale of two stories
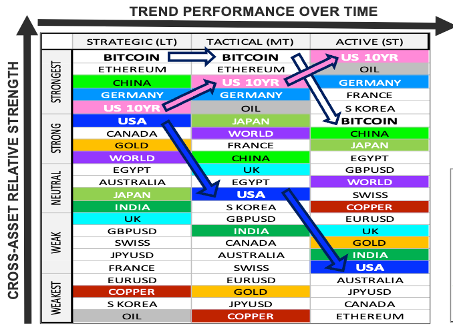
There is also a probability that if high momentum is present then, there is a small chance of it changing again, just after you have bet on it. This led to dividing the trends into quintiles. Strong up, a little up, neutral, a little down and a lot down. Selection only from the top group will easily beat the index. Many investors know how difficult it is to beat the index. They usually try to do it by dealing in small market cap stocks when they have good inside information.
Our system is different. You only deal in stocks that are in the index, but only have the strongest moving quintile of them. We have run this as a system global, cross-asset and found reliable performance. The weakness for the system is volatility. Some markets are more volatile than others, and this makes following the system hard to do. Although, the giant markets work well.
Currently, the global ranking model signals a tale of two stories, of Trump 2.0 election fever, now unwinding, juxtaposed by fear resurgence, both in terms of legacy volatility post-election inauguration season, coupled with a rise of inflation expectations (Figure 5). Watch Gold’s surge higher again, following the unwind from overbought conditions.
Figure 5. Global ranking model, “A Tale of two stories”.
Looking back at history, the pattern analogue for markets now is similar to the top in 2008 (Figure 6). Most markets then fell 50%. Notice how at the top developed a 3-stage corrective pattern, starting with a fall, then rally to new all-time high. That was a bull trap, followed by a crash. There is a growing risk for a similar pattern and there don’t recommend waiting until the end of the uptrend. The downside risk is huge. There are variation of historical rhyme scenarios, good, bad & ugly. Think big, bad, and probably long lasting.
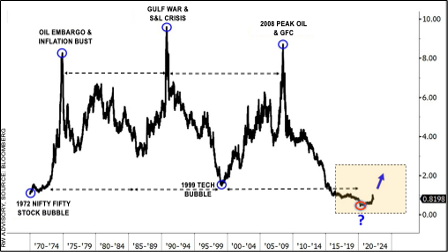
The complicated thing is that we could get a burst of inflation first, or rolling waves of volatility akin to the 1970s (Figure 7). Our long-term cycles suggest this will likely be amplified from H2 2025 onwards, with more disruptive risks to follow into the end of the decade by 2028-2030. The USA is printing money at such a rate, that it seems they want to beat Weimar. A burst up is possible, but we are clear that after it we are coming way lower than it is now. We want out and owning Gold is the only best hedge we can find.
When ranking all assets together Gold comes out at the top of the list. It is probable that commodities will also have a new huge bull period. Starting as they do form very depressed levels (Figure 11). This is not signalled yet but could give a signal soon by three key factors. 1) Relative outperformance. 2) Structural inflation 3) USD weakness.
Risk scenarios & why fear beats greed?
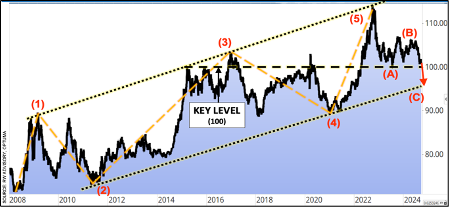
We worry about many things in the world. How many wars do we need before becoming scarred? There is also a real growing concern the USA hegemony is already losing its power, most notably with its USD global reserve currency status. BRICS, as part of a fast emerging new world order, including others, have all agreed not to use USD in the old way. The clincher was when Saudi Arabia agreed to sell its oil in other currencies. The USD will still be a big currency, but to a lesser degree and as part of a transition to a new multi-polar world (Figure 12). The USD premium will likely evaporate. DXY already carved a major peak in 2022 and will confirm a LT trend reversal under historical support at 100 (Figure 13).
Figure 12. Changing world order, into a new multi-polar cycle, marked by BRICS.
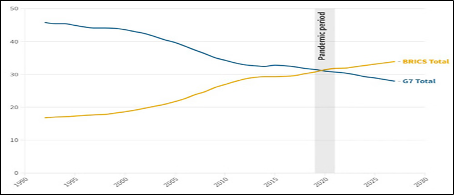
Figure 13. USD (DXY) LT trend reversal under 100.
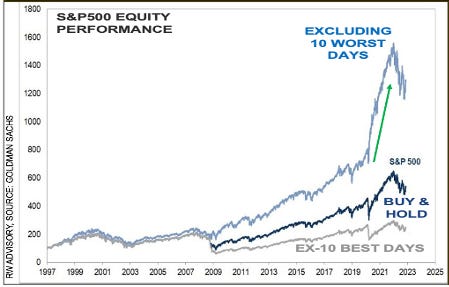
One last point, as part of the theme of behavioural sentiment, is that it is more important to listen to bad news than good. If we look at what has happened in the past then if you only missed out on the ten best days in the year, you massively underperformed the index. However, if in fact you only missed the ten worst days of the year then you massively outperformed. The bottom-line is that fear easily beats greed. So get out relatively early and avoid the crash. You don’t have to see the top of the mountain, leave whilst you still can!
Figure 14. Why fear beats greed in volatile cycles.
Welcome feedback, likes and re-shares. Also remember to check our RWA premium services, for enhanced alpha performance, unique insights & proprietary market timing signals. Select link for more details: https://ronwilliam.substack.com/about
Peer interview exchange hosted by Real Vision.
Latest market insights:
CNBC “Market exuberance will unwind in 2025” link
Real Vision “Trump 2.0: Melt-Up or Cycle Peak?” link
Summary Biographies
Robin Griffiths, FSTA
Robin Griffiths is Senior Advisor & Investment Strategist at RW Advisory.
Robin has served as Head of Multi-Asset Research & Advisory at the ECU Group. He was previously Chief Technical Strategist at HSBC Investment Bank for 20 years, before becoming Head of Global Asset Allocation at Rathbones, and then a director and technical strategist for Cazenove Capital Management. Robin was a Partner of WI Carr and Head of Technical Analysis at Grieveson Grant.
Robin is a committee member and former chairman of the International Federation of Technical Analysts, and former chairman, now fellow, of the British Society of Technical Analysts. Robin has been a member of ECU’s Global Macro Team for over 20 years. Robin has won several Technical Analyst awards for his research.

Ron William, CFTe
Ron William is founder & CIO of RWA, an award-winning, macro-tactical, research and advisory firm, to a wide range of financial institutions & professionals, producing differentiated alpha, insightful idea generation and unique market timing.
He specialises in global, multi-asset, top-down framework, grounded in behavioural technical analysis, driven by cycles, based on the expanded "Roadmap" signature model of veteran market technician Robin Griffiths, originally published in Robin’s book “Mapping the Markets.” Additional insights also featured in their peer interview exchange hosted by Real Vision, T3 reports and Halkin letter contribution.
Driven by impactful education, Ron trains financial institutions and serves on the board of a variety of professional societies, notably as MENA director, education committee member of the International Federation of Technical Analysts (IFTA) and Development Director at the Foundation of the Study of Cycles (FSC).